After having posted on the blog, musing on whether I should spin off the “back-end” of Field Spotter into a separate service, it was inevitable really. I’d nerd-sniped myself into doing it regardless of whether it was a good idea!
The result is Spothole.
It’s a web-based “DX Cluster” for amateur radio, aggregating data from telnet-based DX Clusters, RBN, APRS-IS, POTA, SOTA, WWFF, WWBOTA, GMA, HEMA, Parks n Peaks, and NG3K. As well as its own web interface, it provides tools for other developers to build their own software on top of.
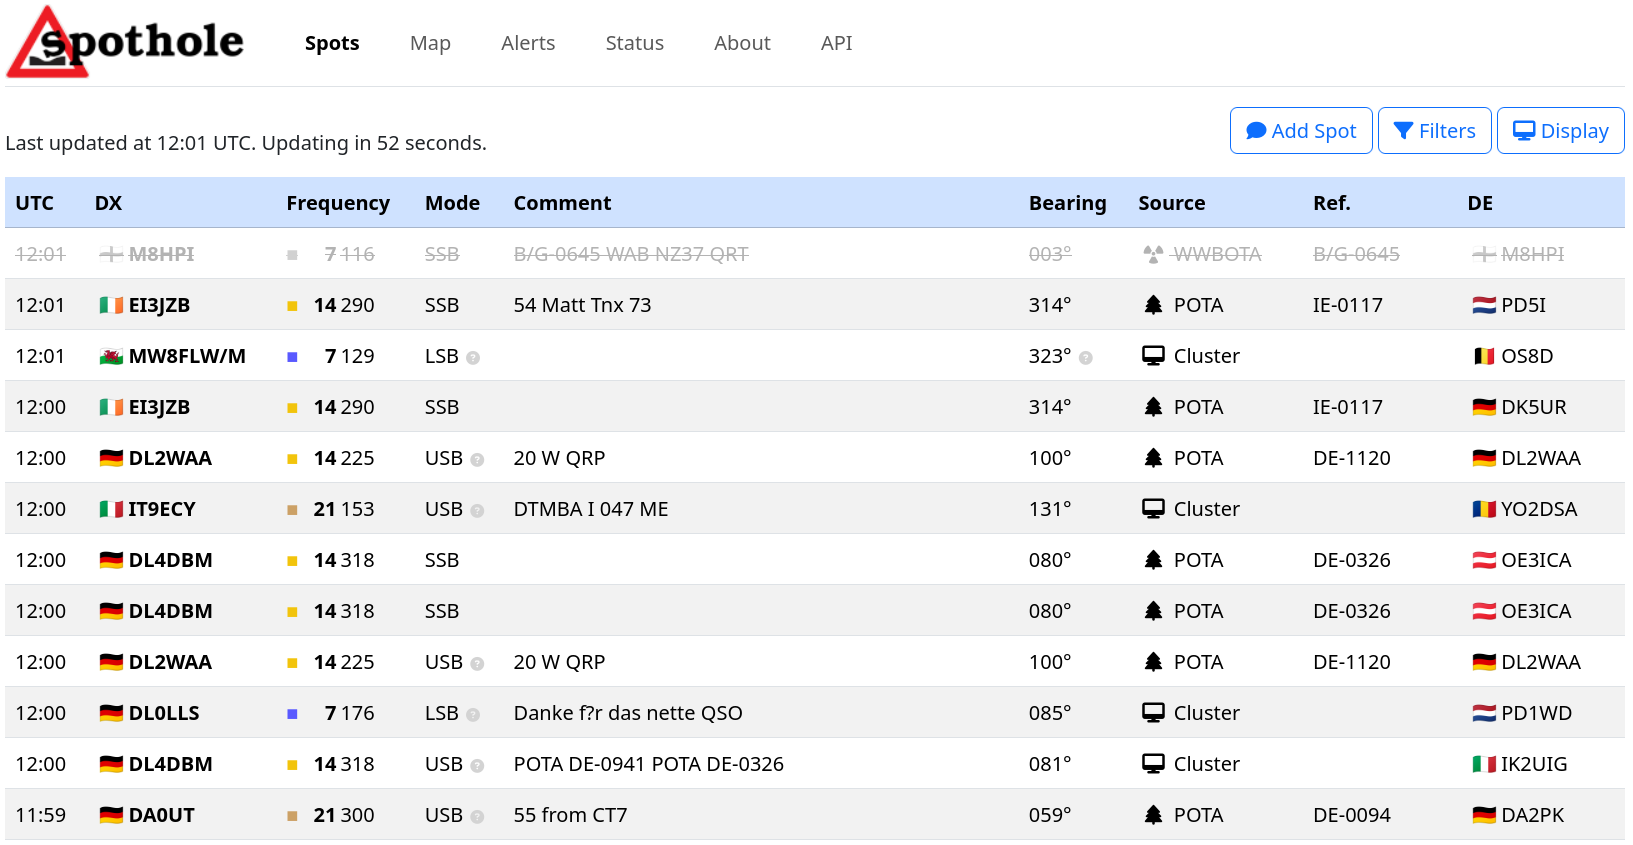 The main Spots page of Spothole, with a table view like other web-based DX Clusters.
Spothole is extensively documented, with its own About page and FAQ, full documentation for its API, and a README file which explains how to set up your own copy of Spothole, modify it, and how to write clients for it.
In my opionion, the key “selling point” for Spothole is its API. While there is a nice website which you can use for your own spotting purposes, the focus has been on the API and making it available for others to build on. Spothole aggregates data from a large number of different places, all of which have their own APIs that you could build on individually, but of course they’re all different to each other. Spothole does the hard work of gathering data from the various sources, and provides it all via one consistent API. If you want to build your own software using that consistent data, Spothole lets you do that.
The API offers plenty of options for fetching data, including the many filters for bands, modes, sources and continents that are used in the web interface.
 Filter options in the spot list.
The original aim was to “extract” the API lookup code from Field Spotter, and now that Spothole is stable, work will begin on that. This allows Field Spotter to become simpler, querying one API instead of five, and it also allows it to look up data from services like Parks n Peaks and HEMA, which were inaccessible to a pure web app due to missing CORS headers or HTTPS support.
In the mean time, I’ve also implemented a map directly in Spothole, making it my 15th (!!) piece of software at the intersection of radio and mapping. This isn’t as tailored to xOTA operations as Field Spotter is, providing a way to show Cluster spots and where people have been spotted from, but not yet inheriting the full feature set from Field Spotter.
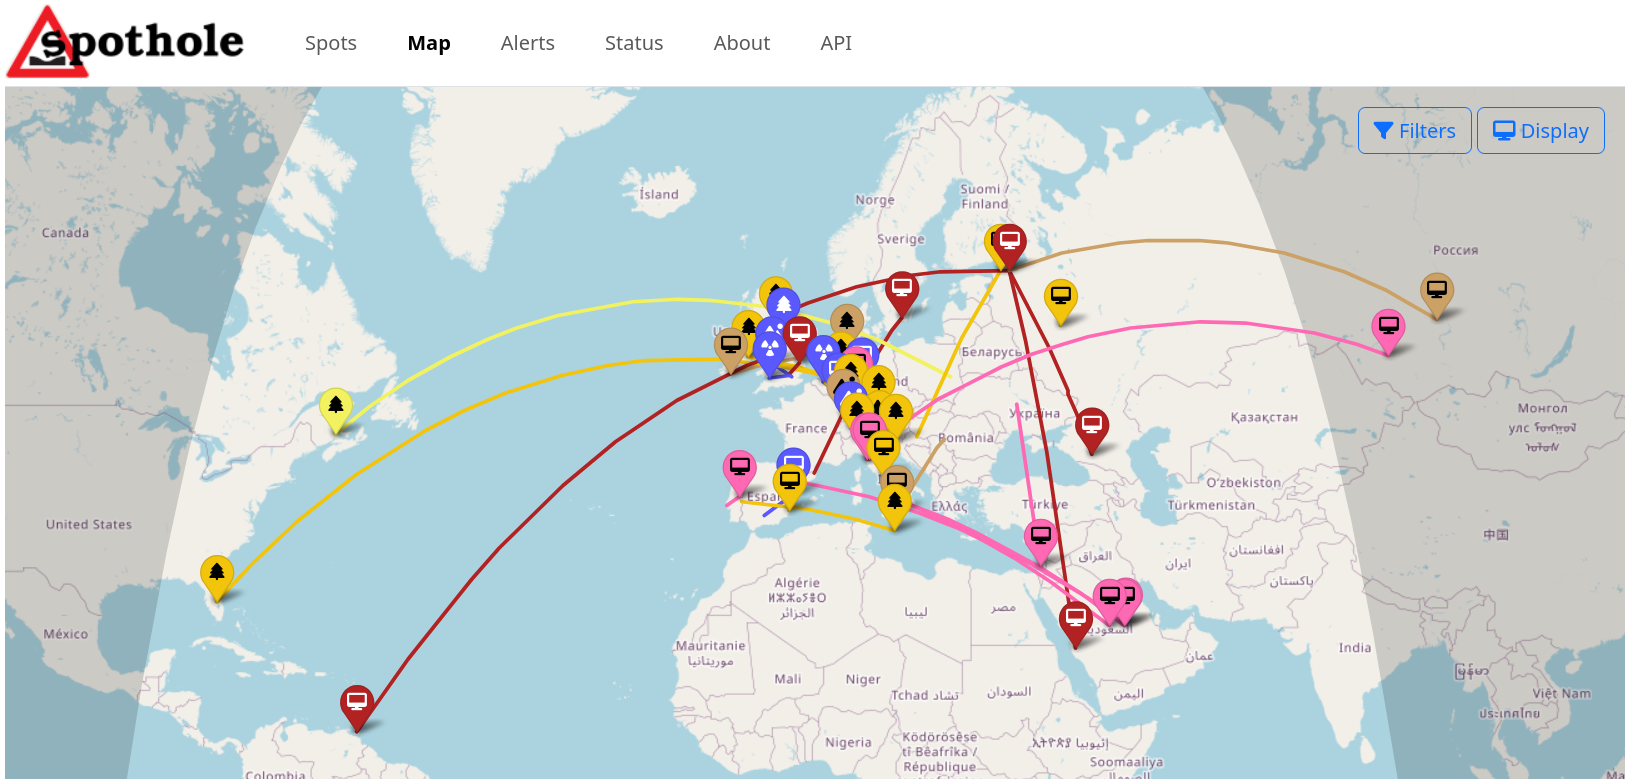 Spothole’s map page.
The “bands” display has also made it across from Field Spotter, allowing you to see the spots visually against the various amateur radio bands.
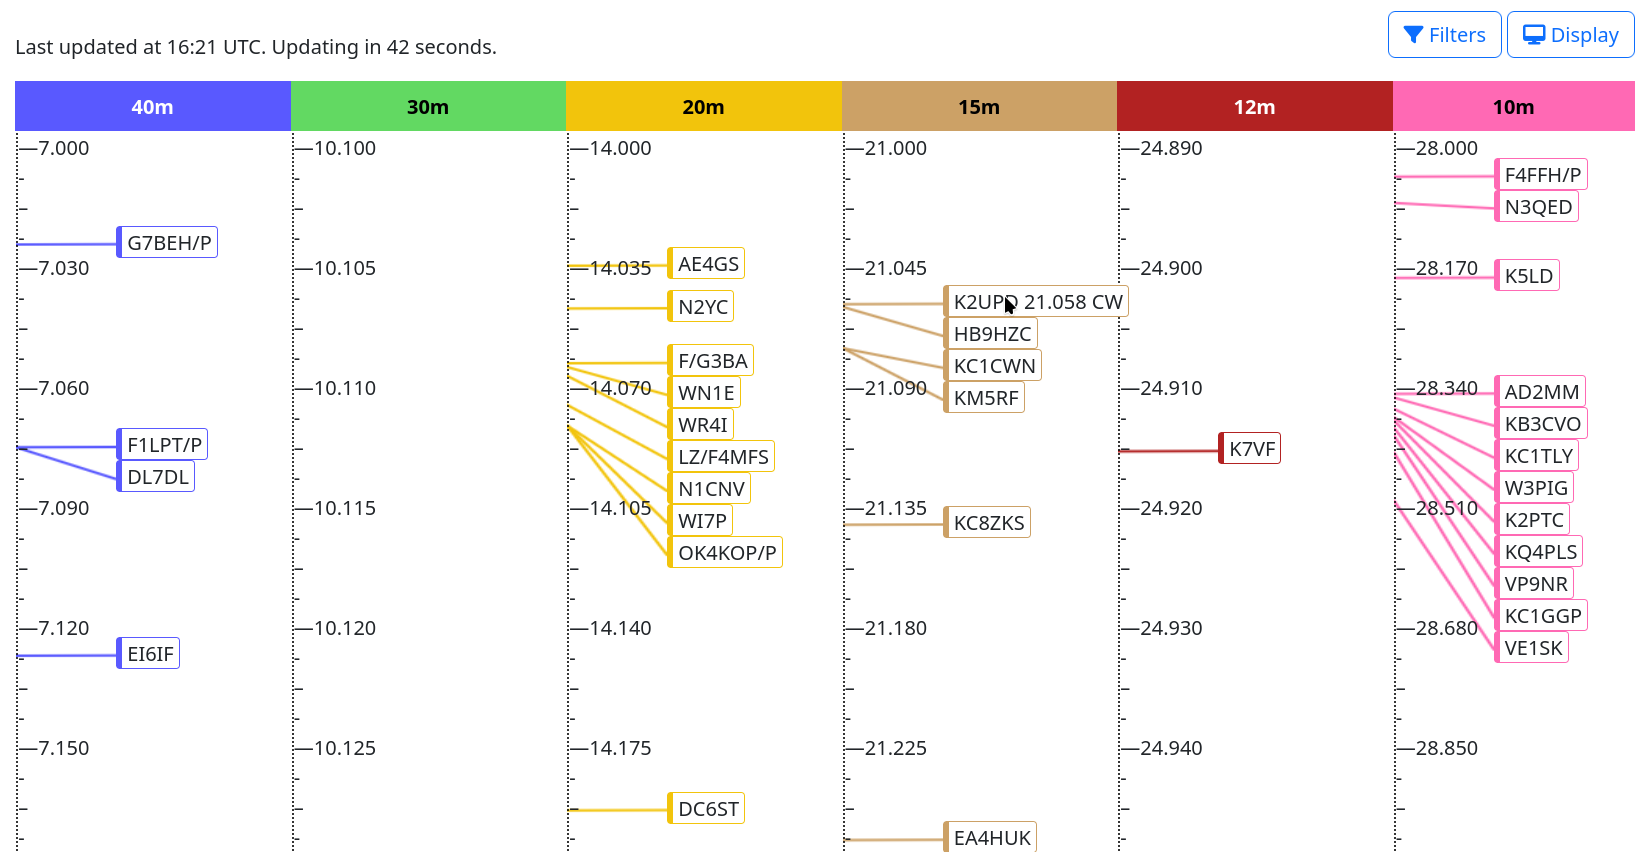 The bands view.
As well as spots, “alerts” are also supported. These are a mixture of upcoming activations from xOTA sites, and DXpeditions.
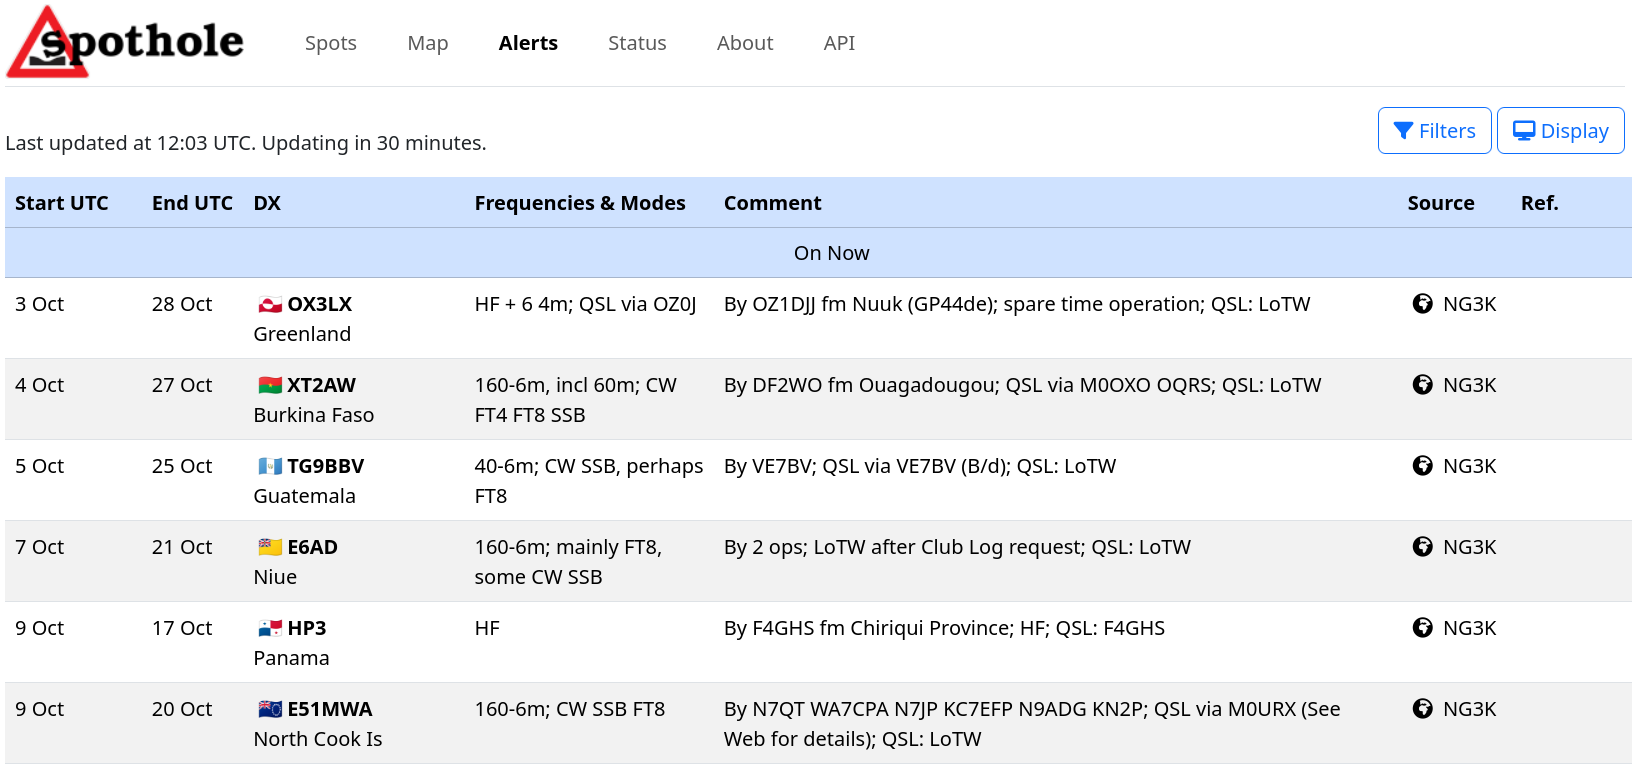 Spothole’s alerts page.
Spothole’s web interface is fully responsive and should work fine on all mobile devices as well as desktop and laptop computers. It’s available as a Progressive Web App (PWA), which means if you open it in Safari on iOS or Chrome on Android, you should be able to “install” it to your home screen, if that’s useful to you.
The final thing to say about Spothole is that of course it’s fully open source. The source code is here and is Public Domain licenced, which means you are free to take it and do anything you like with it. It’s easy to write your own spot and alert providers, and you can contribute them back or keep them to yourself if you prefer. And as usual the software has no ads, no tracking cookies, and is completely free to use.
Happy spotting!
Comments