Last time around, on day 23 of the build diary, we connected up an I2C rangefinder and compass module to the Raspberry Pi, and checked their functionality using stand-alone applications. Today, we’re going to integrate them into the main code that runs the tank, rt_http.
Step 1. To the C!
Each of the sensors was provided with a few lines of C code which could be used to read data from them and display it on the screen.
It proved very easy to combine these into a single routine – we don’t need to open and close the I2C port once for the compass and again for the rangefinder – and add it to rt_http. The new sensor sampling routine runs in its own thread, and every second or so uses a mutex lock to dump the sensor readings to global variables. (Hardly elegant, I know.)
It also dumps the readings to stdout for debug purposes, which you can see in action below.
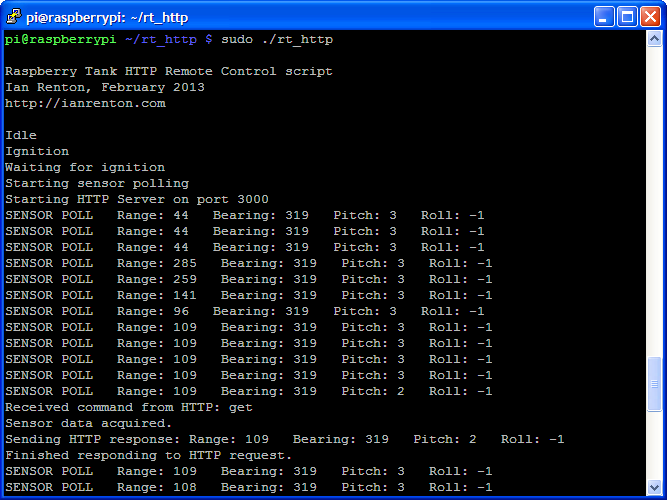
rt_http Console Output
You can download the latest rt_http code from GitHub.
Step 2. The Trouble with Javascript
The intention was to add more functionality to the embedded HTTP server by providing a URL (e.g. http://raspberrytank:3000/?get) that could be used to return this data. I tried this and it worked fine – you can still see the code in rt_http.c, although it is commented out.
The problem is that I wanted to display the sensor data on the main web interface, and the best way to do this is using JavaScript (in my case, using the jQuery library) to request the URL and insert the results into a <div/> on the page. That would work in this case, except that the server that provides the Web UI pages runs at http://raspberrytank:80/, while the Mongoose server embedded in rt_http runs at http://raspberrytank:3000 – a different port. Web browsers perceive this as a different domain, and therefore to prevent cross-site request forgeries, they prevent JavaScript from being able to query the Mongoose server.
As a work-around, I decided to put the sensor data somewhere that lighttpd – the server behind the main web interface – could find it. Unfortunately I achieved this by getting the sensor polling function to write the sensor data to /var/www/sensordata.txt as well as stdout.
There are a few problems with this: it assumes that the web UI will be served from /var/www, there is a potential conflict if the web server tries to read the file while the control code is writing to it, and it’s just plain ugly. But it works. I will make this more elegant later!
Step 3. Pulling in the Sensor Data
As I mentioned just now, the Web UI now uses jQuery to pull the sensor data into the web pages it serves. This is done with a $.get() request using the jQuery library, which fires once a second.
If the file is being written to at the point the JavaScript tries to read it, it will look as if the file is blank, so if this is the case then the web page isn’t updated.
Step 4. Forking the Web UI
The Web UI previously existed as a portrait-orientated interface that assumed the user was using a touch device such as a tablet or phone. As we discovered to our cost on day 17, the “press and hold” behaviour we used for the control buttons wasn’t appropriate for these devices, so we had to drop back to using a single press to start an action and a single press on the STOP button to stop it.
During testing I have mostly been using a laptop. Not only is “press and hold” possibly on a laptop, it’s much more user-friendly. A landscape orientation would also be much more usable on a laptop screen.
For this reason, the Web UI now comes in two flavours – laptop (non-touch) and phone/tablet (touch). Visiting http://raspberrytank/ will give you a menu to choose which UI you prefer.
An example of the new laptop orientation, including the sensor data, is shown below.
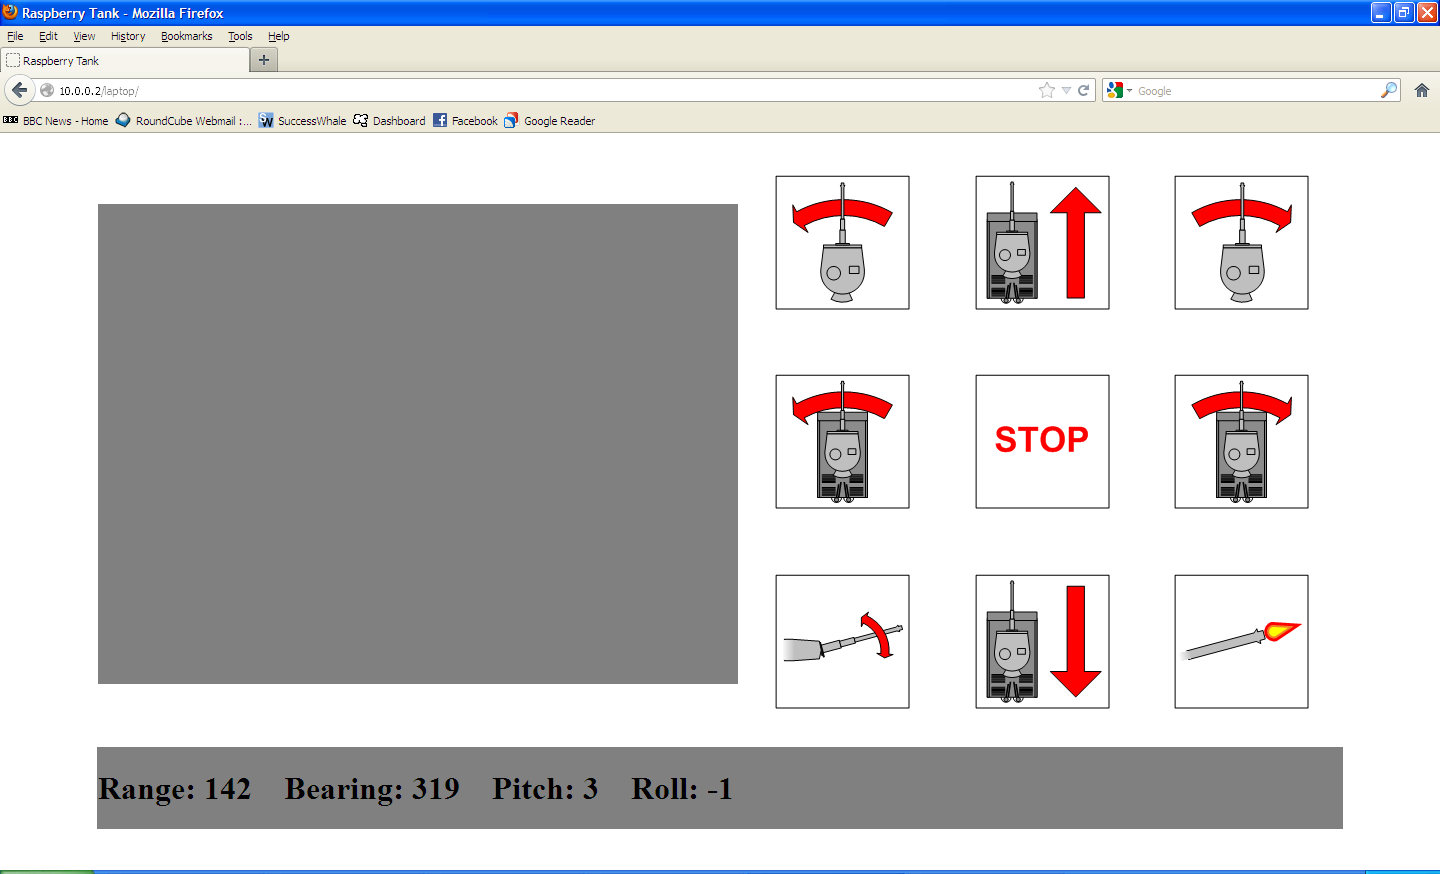
Laptop Web UI with Sensor Data
As always, the Web UI code is available on GitHub.
All my code is released under the free, open-source BSD licence. (But we do use libraries such as Mongoose and jQuery that have their own licence terms.)
Comments
Hi Ian,
Thanks for your superb writeup of the build so far! I’ve been recreating it myself and it’s been great fun.
I wondered if you’d considered serving up your web UI from the embedded mongoose server, thus avoiding the need for lighttpd on a different port and the cross-domain problems that causes?
I ended up just declaring a
documentrootin yourrthttp.cscript, and running mongoose on port 80:const char *options[] = {"listening_ports", "80",
"document_root", "www", // This is where I have my web assets - you could also declare an absolute path such as /home/pi/raspberrytank/web-ui
NULL
};
Then with the following tweak to the
ifstatement inhttp_callback, you should see the web UI in your browser:if (event == MGNEWREQUEST && requestinfo->querystring) {The fact everything’s running on port 80 should mean JavaScript will have no issues grabbing sensor data in the background and displaying it on the page.
I imagine mongoose has a pretty basic feature set compared to lighttpd, but it seems to be doing what I need so far. I see it also has support for Websockets, which I’m hoping to look into soon as a way of getting realtime communications between the tank and the web UI.
You're right, if Mongoose supports serving pages from disk for some HTTP requests and handling others internally, that's a much nicer way of serving the web content. I don't think the tank's web server will really need any of lighttpd's more advanced capabilities, so this should be fine.
I looked into using WebSockets when I first started the web UI for the tank, as I'm much more comfortable working with full-duplex TCP/IP sockets and connections than I am with HTTP requests. However, when I was first playing with the web UI, the only browser available to me (unfortunately!) was IE8 which doesn't have WebSocket support. I decided to do without them for browser compatability reasons, but if WebSockets make the comms a lot easier then it could be time to revisit that.
Mongoose has some pretty sane defaults in that if a request corresponds to a file on disk it'll serve it directly - otherwise it'll handle it internally. It's ideal for this setup because the web UI 'just works', but you can still process dynamic URLs (e.g the tank's movement commands) in the background!